California Housing
This project explores California’s housing market using a cleaned dataset containing neighborhood-level statistics on income, home values, and geographic location. Through interactive and static visualizations, it examines how factors like average household income, proximity to the ocean, and geographic coordinates relate to median house prices. The analysis uses R and visualization tools like ggplot2 and Leaflet to uncover spatial and economic patterns, offering insights into the forces shaping housing affordability and regional disparities across California.
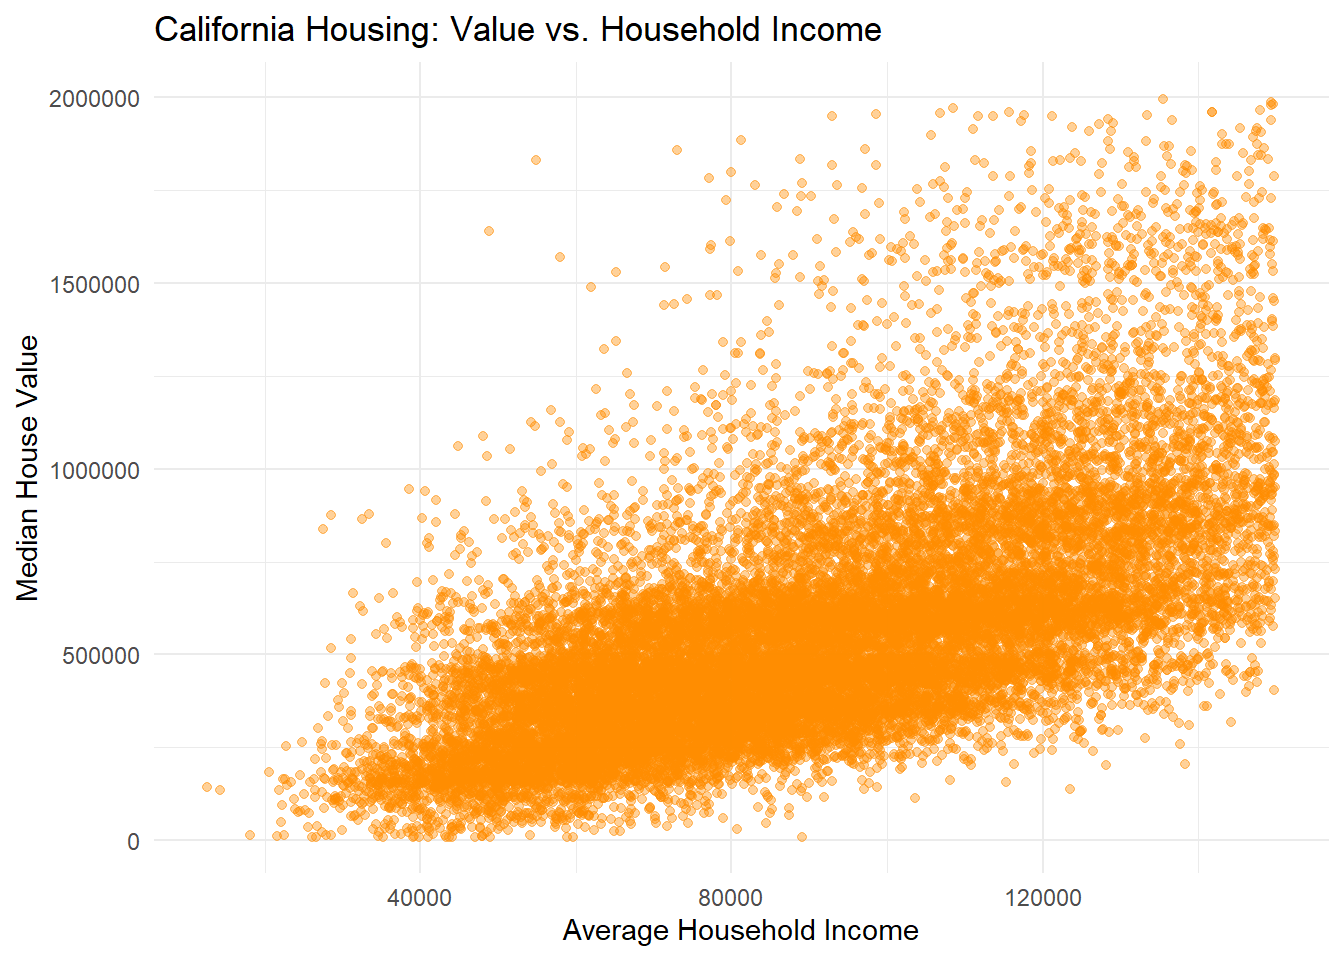
This scatter plot visualizes the relationship between average household income and median house value across California. Each point represents a housing block, with orange markers indicating individual observations. The graph reveals a positive correlation—areas with higher household incomes generally tend to have higher median house values. However, the spread in values also suggests that income alone does not fully explain housing prices, pointing to other influential factors such as location, proximity to urban centers, or coastal access. This visualization helps highlight the economic diversity and housing market disparities within the state.