Ocean Proximity
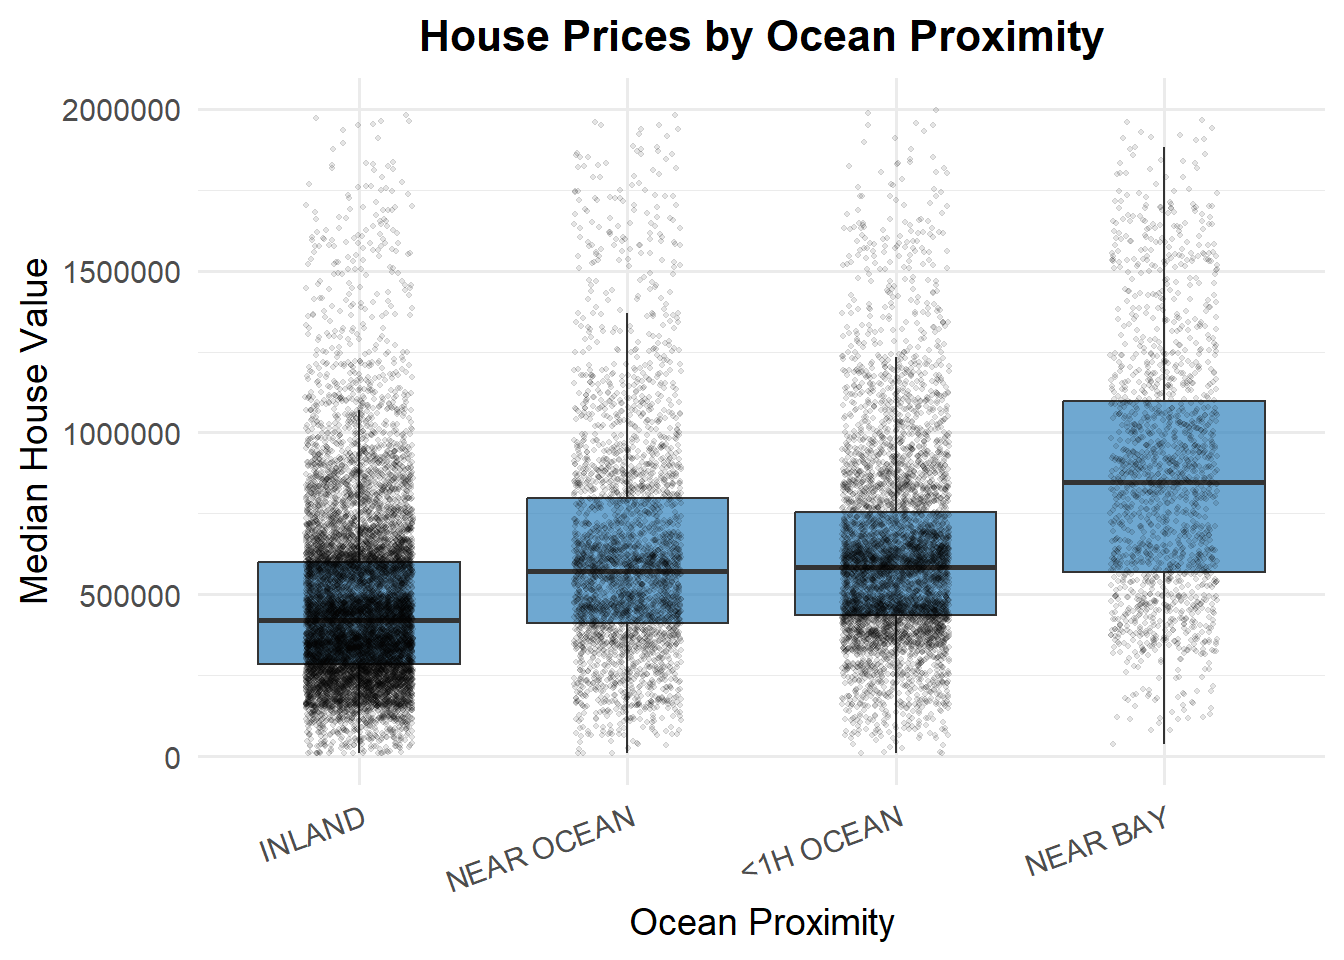
This boxplot explores how proximity to the ocean affects median house values in California. Properties are grouped into categories like “Near Bay”, “Inland”, and “Near Ocean”, with the boxes showing the distribution of house prices within each group. As expected, homes closer to the coast—particularly those “Near Bay” or “Near Ocean”—tend to have higher median values, while inland homes are generally more affordable. The jittered points overlay adds a layer of raw data visibility, confirming that coastal proximity correlates strongly with elevated housing prices.
The animation illustrates how median house value changes in relation to the average age of houses, evolving over different levels of ocean proximity or income bands (depending on how the animation was constructed). As the frames shift, patterns emerge showing how newer or older developments in various regions align with housing costs. The motion highlights trends over time or across categories, providing dynamic insight that complements the static graphs.