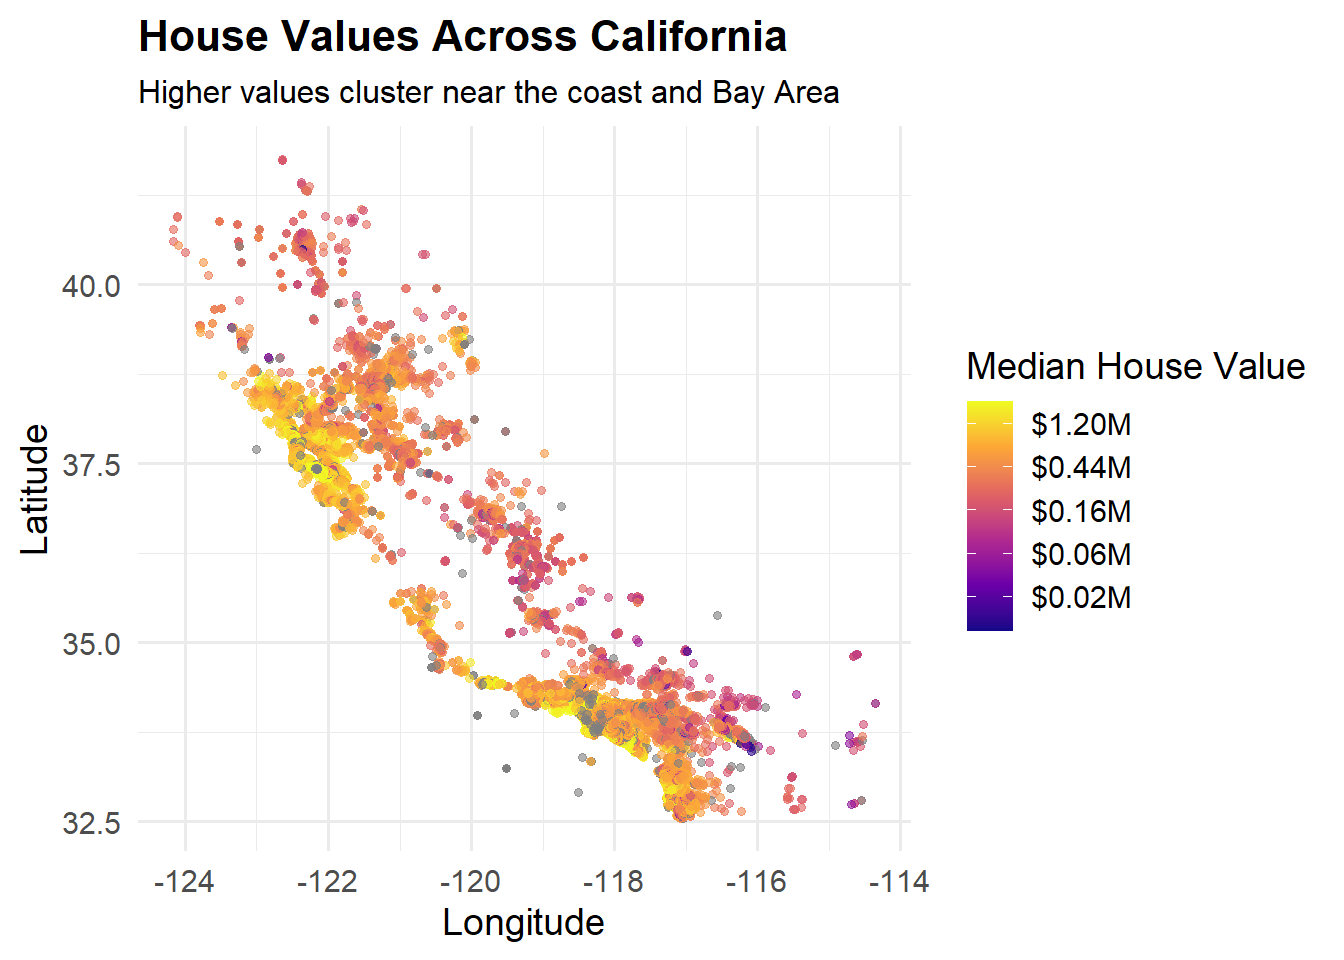
Map
This static map visualizes median house values across California using geographic coordinates. Each point represents a housing location, colored according to its median house value. A logarithmic color scale highlights variations more effectively, making clusters of high-value properties along the coast and the Bay Area more prominent. The visualization clearly shows that coastal regions, especially around San Francisco and Los Angeles, command significantly higher housing prices, emphasizing the geographic disparity in real estate valuation.
This interactive Leaflet map allows users to explore housing data across California dynamically. It samples 2,000 housing locations for performance and displays each one as a circle marker, color-coded by house value. Hovering or clicking reveals detailed popups with neighborhood names, median house values, and average household incomes. The map provides an intuitive, zoomable view of spatial trends in housing, making it easy to identify high-value clusters and compare different regions interactively.